Histograms with clusters
Hist(
  x,
  classes = NULL,
  plot = TRUE,
  col = 2:10,
  mode = c("classical", "cumsum", "density"),
  breaks = "Sturges",
  ...
)
Arguments
| x | a vector, matrix or data.frame on which the histogram will be computed and ploted. |
|---|---|
| classes | vector of classes to color |
| plot | if FALSE, the histogram is only computed with no graphical output. |
| col | numeric color |
| mode | one of c("classical","cumsum","density") |
| breaks | by default: "Sturges" |
| ... | further arguments and graphical parameters passed to plot.histogram and thence to title and axis. |
Examples
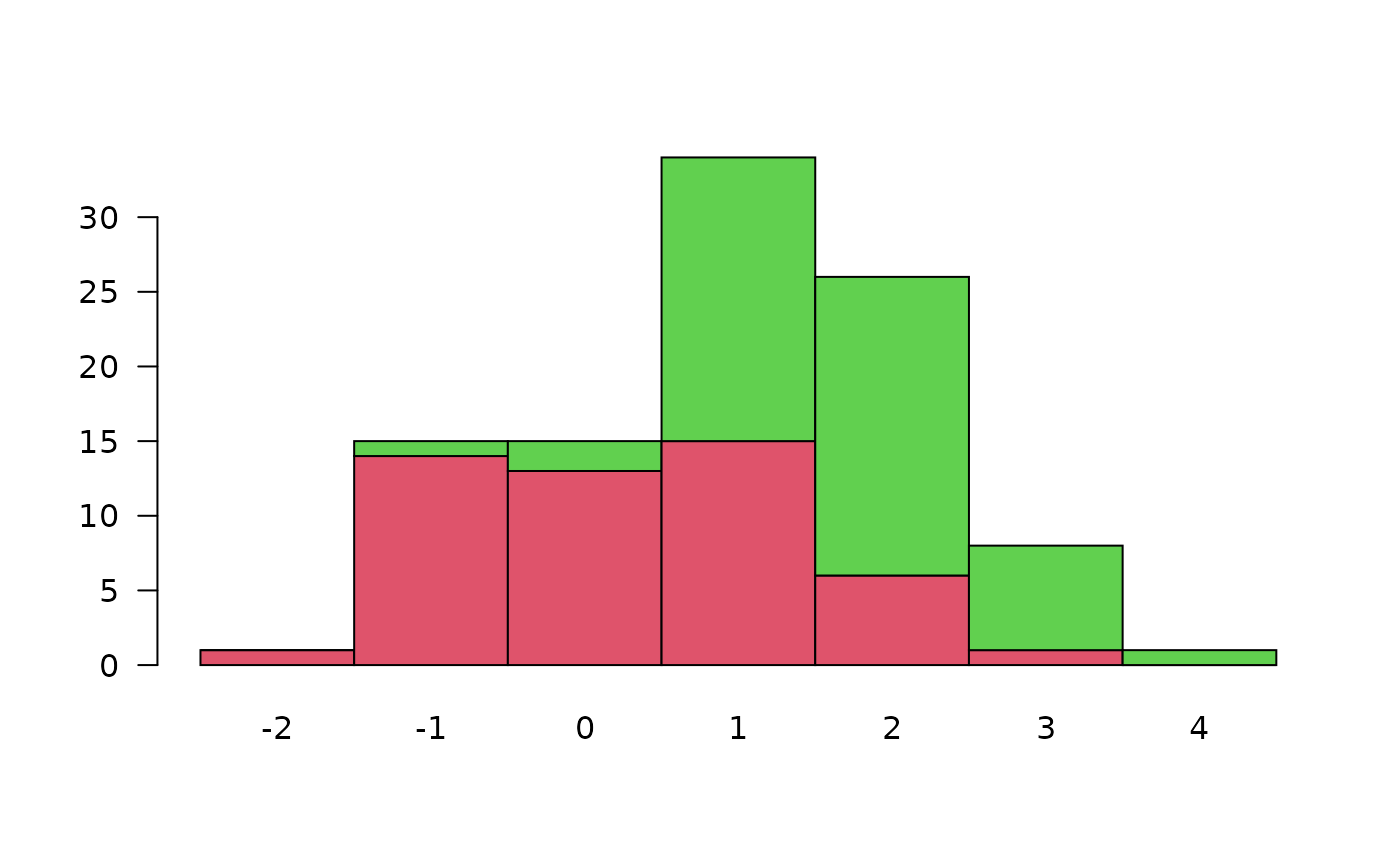
#> $counts #> [,1] [,2] [,3] [,4] [,5] [,6] [,7] #> hvi 1 14 13 15 6 1 0 #> hvi 0 1 2 19 20 7 1 #>