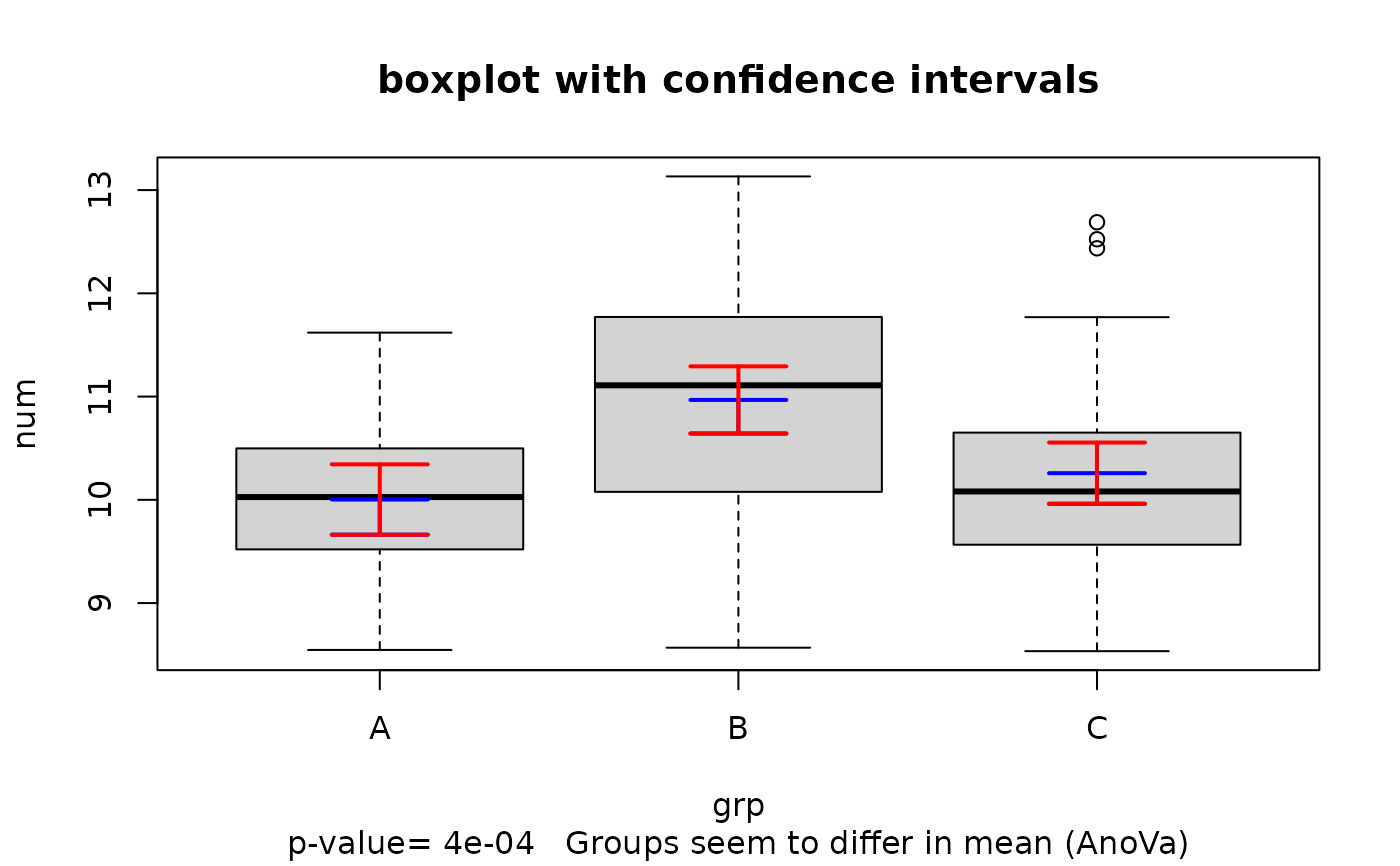
classical boxplot function improved with integrated confidence level on the mean for each group ploted on the graph and also ANOVA with p-value and its interpretation given in the legend.
BoxPlot(
  num,
  grp = NULL,
  data = NULL,
  AnoVa = TRUE,
  risk = 0.05,
  lang = c("en", "fr"),
  verbose = TRUE,
  ...
)
Arguments
| num | a numeric vector to plot boxplot(num~grp). Represents the value that will be compared between the groups. |
|---|---|
| grp | a qualitative vector (factor) to plot boxplot(num~grp). Represents the groups we will compare. |
| data | a data.frame (or list) from which the variables in formula should be taken. |
| AnoVa | boolean to compute or not anova (when multiple groups) to see if they differ in mean.If false the Kruskal-Wallis Rank Sum test is computed instead. |
| risk | the risk value used for confidence intervals. |
| lang | lingustic parameter to specify the language of the legend |
| verbose | boolean to make a test and print the result in the subtitle |
| ... | Other graphical parameters |
Examples
repart = c(20, 40, 40) X = data.frame(num = c(rnorm(repart[1], 10, 1), rnorm(repart[2], 11, 1), rnorm(repart[3], 10, 1)), grp = rep(c("A", "B", "C"), repart)) BoxPlot(X$num, X$grp, data = X, ylab = "num", main = "boxplot with confidence intervals")#> $stats #> [,1] [,2] [,3] #> [1,] 8.546154 8.567889 8.534136 #> [2,] 9.520118 10.077296 9.565248 #> [3,] 10.026859 11.109004 10.080954 #> [4,] 10.498172 11.771308 10.651118 #> [5,] 11.619380 13.132364 11.769219 #> #> $n #> [1] 20 40 40 #> #> $conf #> [,1] [,2] [,3] #> [1,] 9.681314 10.68581 9.809682 #> [2,] 10.372404 11.53220 10.352226 #> #> $out #> [1] 12.52376 12.43629 12.68865 #> #> $group #> [1] 3 3 3 #> #> $names #> [1] "A" "B" "C" #> #> $pval #> [1] 0.0003602925 #> #> $confint #> [,1] [,2] [,3] #> upper 10.343555 11.29294 10.554855 #> mean 10.002902 10.96760 10.258245 #> lower 9.662249 10.64226 9.961635 #> #> $risk #> [1] 0.05 #># Confidence interval in red with mean in blue.